Chapter 14. Obstetrical Imaging
BS. Nguyễn Hồng Anh
Obstetrical ultrasound is undamental to prenatal care. It is
used to conrm gestational age and viability; to detect and
characterize abnormalities o the etus, amnionic uid, and
placenta; and to assist with diagnostic and therapeutic procedures.
Ultrasound practice continues to evolve. Te number o
components included in the second-trimester standard and
detailed etal anatomical surveys has expanded. With improved
image resolution, etal abnormalities are increasingly identied
in the late rst trimester. Tis has prompted the requirement or
a limited anatomical survey during the standard rst-trimester
examination and has led to the development o a new detailed
rst-trimester examination. Detailed placental evaluation is a
new specialized examination to aid detection and characterization o placenta accreta spectrum.
Across the United States, pregnant women receive ultrasound examinations in various practice settings staed by
obstetrician–gynecologists, maternal–etal medicine specialists, and radiologists. Ideally, examinations are perormed by
registered diagnostic medical sonographers or physicians with
certication in their area(s) o practice and in units accredited
by the American Institute o Ultrasound in Medicine (AIUM)
or American College o Radiology. Components o accreditation include evidence o physician training, sonographer credentialing, continuing medical education, and protocols and
procedures to ensure proper and sae ultrasound practice. One
important component is independent review o submitted
images.
o standardize ultrasound education or residents in obstetrics and gynecology and ellows in maternal-etal medicine,
the American College o Obstetricians and Gynecologists,
the Society or Maternal-Fetal Medicine, and the AIUM have
developed consensus documents (Abuhamad, 2018; Benacerra, 2018). A ocus o training—and o ultrasound practice—is
standardization o an ultrasound curriculum and provision o
competency assessment tools or image acquisition.
TECHNOLOGY AND SAFETY
Te image on the ultrasound screen is produced by sound
waves that are reected back rom uid and tissue interaces o
the etus, amnionic uid, and placenta. Ultrasound transducers
contain groups o piezoelectric crystals that convert electrical
energy into sound waves and convert returning sound waves
back into electrical energy. Te sound waves are emitted in
synchronized pulses. As these pulses pass through tissue layers, dense tissue such as bone produces high-velocity reected
waves. With routine gray-scale imaging, which is also known as
brightness-mode (B-mode), these reected waves are displayed
as bright echoes on the screen. Conversely, uid generates ew
reected waves and appears dark. Digital images generated at
50 to more than 100 rames per second undergo postprocessing
that yields the appearance o real-time imaging.
Ultrasound reers to sound waves traveling at a requency
above 20,000 hertz (Hz [cycles per second]). ransducers use
wide-bandwidth technology to perorm within a range o requencies. Higher-requency transducers yield better image
resolution, whereas lower requencies penetrate tissue more
eectively. In early pregnancy, a 5- to 12-megahertz (MHz)
transvaginal transducer usually provides excellent resolution,
because the early etus lies close to the transducer. In the rst and
second trimesters, a 4- to 6-MHz transabdominal transducer is
similarly sufciently close to the etus to yield precise images.
By the third trimester, however, a lower-requency 2- to 5-MHz
transducer may be needed or tissue penetration— particularly
in obese patients—and this can lead to compromised image
resolution.
■ Embryo and Fetal Safety
Sonography should be perormed only or a valid medical
indication and use the lowest possible exposure setting to gain
necessary inormation. Tis is the ALARA principle—as low
as reasonably achievable. Examinations are perormed only by
those trained to recognize etal abnormalities and artiacts that
may mimic pathology and with techniques to avoid ultrasound
exposure beyond what is considered sae or the etus (American
College o Obstetricians and Gynecologists, 2020; American
Institute o Ultrasound in Medicine, 2018a). No causal relationship has been demonstrated between diagnostic ultrasound
and any recognized adverse eect in human pregnancy. Te
International Society o Ultrasound in Obstetrics and Gynecology (2016) urther concludes that there is no scientically
proven association between ultrasound exposure in the rst or
second trimesters and autism spectrum disorder or its severity.
All ultrasound machines are required to display two indices: the thermal index and the mechanical index. Te thermal
index measures the relative probability that the examination
may raise the temperature enough to induce injury. However,
etal damage resulting rom commercially available ultrasound
equipment in routine practice is extremely unlikely. Te potential or temperature elevation is higher with longer examination
time and is greater near bone than in sot tissue. Teoretical
risks are higher during organogenesis than later in gestation.
Te thermal index or sot tissue, Tis, should be used beore
10 weeks’ gestation, and that or bone, Tib, at or beyond
10 weeks (American Institute o Ultrasound in Medicine, 2018a).
Te thermal index is higher with pulsed Doppler applications than with routine B-mode scanning. In the rst trimester, i pulsed Doppler is clinically indicated, the thermal
index should be ≤0.7, and the exposure time should be as
brie as possible (American Institute o Ultrasound in Medicine, 2020b). Tis is an important consideration when pulsed
Doppler is applied to assist with identication or characterization o suspected abnormalities at 11 to 14 weeks’ gestation.
o document the embryonic or etal heart rate, motion-mode
(M-mode) scanning is used instead o pulsed Doppler imaging.
Te mechanical index is a measure o the likelihood
o adverse eects related to rareactional pressure, such as
cavitation, which is relevant only in tissues that contain air.
Microbubble ultrasound contrast agents are not used in pregnancy or this reason. In mammalian tissues that do not contain
gas bodies, no adverse eects have been reported over the range
o diagnostically relevant exposures. Fetuses cannot contain gas
bodies and thus are not considered at risk.
Te use o ultrasound or any nonmedical purpose, such as
“keepsake etal imaging,” is considered contrary to responsible
medical practice and is not condoned by the Food and Drug
Administration (FDA) (2019), the American Institute o Ultrasound in Medicine (2020b), or the American College o Obstetricians and Gynecologists (2020b). However, images or video
clips rom medically indicated ultrasound examinations may be
shared with patients.
■ Operator Safety
Te reported prevalence o work-related musculoskeletal discomort or injury among sonographers approximates 70 percent (Janga, 2012; Roll, 2012). Te most common injuries are
capsulitis and tendonitis o the shoulder, epicondylitis o the
elbow, carpal and cubital tunnel syndrome, and neck or back
strain (Murphey, 2018). Te main risk actors or injury during
transabdominal ultrasound examinations are awkward posture,
sustained static orces, and various pinch grips used to maneuver the transducer (Centers or Disease Control and Prevention, 2006). Excessive exion, extension, or abduction while
scanning places stress on joints and muscles. ask repetition
without adequate recovery time may compound risks. Maternal
habitus can be contributory because more orce is oten needed
when imaging obese patients.
Te ollowing guidelines may help avert injury:
1. Position the patient close to you on the examination table.
As a result, your elbow is close to your body, shoulder abduction is <30 degrees, and your thumb is acing up.
2. Adjust the table or chair height so that your orearm is parallel to the oor.
3. Use a chair with back support, i seated. Avoid leaning
toward the patient or monitor. Support your eet, and keep
ankles in neutral position.
4. Face the monitor squarely and position it so that it is viewed
at a neutral angle rom the horizon, such as 15 degrees
downward.
5. Avoid reaching, bending, or twisting while scanning.
6. ake requent breaks to help prevent muscle strain. Stretching and strengthening exercises can be helpul.
GESTATIONAL AGE ASSESSMENT
Gestational age is based on two things: the certainty o the
woman’s last menstrual period (LMP) date and measurements
o the embryo or etus at the initial ultrasound examination.
Gestational sac measurement is not suitable or gestational
age assignment. I the LMP is certain, the estimated due date
(EDD) is based on LMP unless the date–measurement discrepancy exceeds thresholds listed in Table 14-1 (American
College o Obstetricians and Gynecologists, 2019b,c). I the248 The Fetal Patient
Section 6
discrepancy exceeds these thresholds, or i the LMP is uncertain or unknown, ultrasound measurements establish the
EDD.
Ultrasound measurement o the crown-rump length (CRL)
is the most accurate method to establish or conrm gestational
age (Appendix, p. 1234). ransvaginal imaging yields higher
resolution images. Te CRL is measured in the midsagittal
plane with the embryo or etus in a neutral, nonexed position. Tis allows its length to be measured in a straight line
(Fig. 14-1). Te mean o three discrete measurements is used.
Beore 14 weeks’ gestation, the CRL is accurate to within 5 to
7 days (American College o Obstetricians and Gynecologists,
2019c).
Starting at 140/7 weeks’ gestation, the biparietal diameter,
head circumerence, abdominal circumerence, and emur
length should be measured. Equipment sotware ormulas calculate estimated gestational age and etal weight rom these
our biometric parameters. Te accuracy o the etal weight estimate is assumed to be within 15 percent o the actual weight
(American Institute o Ultrasound in Medicine, 2018a). Measurement criteria are discussed in Chapter 15 (p. 272).
Beore 22 weeks, gestational age assessment using these
our biometric parameters is accurate to within 7 to 10 days
(American College o Obstetricians and Gynecologists, 2019c).
Various nomograms are available or other structural measurements, including the transverse cerebellar diameter, orbital distances, thoracic circumerence, and length o the ear, kidney,
long bones, and eet. Tese may be used to address specic
questions regarding organ system abnormalities or syndromes
(Appendix, pp. 1238–1241).
I the initial ultrasound examination is perormed at or
beyond 22 weeks’ gestation, the pregnancy is suboptimally dated
(American College o Obstetricians and Gynecologists, 2019b).
In such cases, subsequent ultrasound evaluation in 3 to 4 weeks
may be considered. Tis is especially true i the ultrasound measurements are smaller than expected or gestational age based
on LMP and thus poor etal growth is a possibility.
Fertilization is presumed to occur 2 weeks ater a condent
LMP. Tereore, or pregnancies achieved with in vitro ertilization and resh transer, 266 days are added to the egg-retrieval/
ertilization date to calculate the EDD. Similarly, i using a
day-3 rozen embryo, adding 263 days accounts or the days o
embryo culture. For pregnancies conceived with intrauterine
insemination, LMP is used.
FIRST-TRIMESTER ULTRASOUND
Te three types o rst-trimester examinations include standard
ultrasound; nuchal translucency evaluation—between 11 and
14 weeks’ gestation; and detailed rst-trimester anatomy evaluation between 12 and 14 weeks’ gestation.
Indications or the standard rst-trimester examination
are listed in Table 14-2 (American College o Obstetricians
and Gynecologists, 2020; American Institute o Ultrasound
in Medicine, 2018a). Early pregnancy can be evaluated with
transabdominal or transvaginal sonography, or both. Te components listed in Table 14-3 should be assessed (American

TABLE 14-1. Assessment of Gestational Age
Gestational Agea Parameter(s)
Threshold Value
to Redateb
<9 wks CRL >5 d
9 to <14 wks CRL >7 d
14 to <16 wks BPD, HC, AC, FL >7 d
16 to <22 wks BPD, HC, AC, FL >10 d
22 to <28 wks BPD, HC, AC, FL >14 d
≥28 wks BPD, HC, AC, FL >21 d
aBased on last menstrual period (LMP).
bUltrasound gestational age should be used if it differs
from the LMP-derived gestational age by more than the
threshold value.
AC = abdominal circumference; BPD = biparietal diameter; CRL = crown-rump length; FL = femur length;
HC = head circumference.
A B

FIGURE 14-1 A. The measured crown-rump length is approximately 7 mm in this 6-week embryo. B. M-mode demonstrates embryonic
cardiac activity and a heart rate of 124 beats per minute.Obstetrical Imaging 249
CHAPTER 14
College o Obstetricians and Gynecologists, 2020; American
Institute o Ultrasound in Medicine, 2018a). Te rst trimester
is the ideal time to evaluate the uterus, adnexa, and cul-desac. Ultrasound interrogation at this time can reliably diagnose
anembryonic gestation, embryonic demise, ectopic pregnancy,
and gestational trophoblastic disease. In a multietal gestation,
determination o chorionicity is most accurate in the rst trimester (Chap. 48, p. 841). Gestational sac implantation in a
prior cesarean scar is increasingly detected in the rst trimester
as well.
An intrauterine gestational sac may be consistently visualized with transvaginal sonography by 5 weeks’ gestation, and an
embryo with cardiac activity by 6 weeks. Te embryo should be
visible transvaginally once the mean sac diameter has reached
25 mm—otherwise the gestation is anembryonic. Whenever
an embryo or etus is identied, it should be measured, and
cardiac motion should be documented with either video clip
or M-mode scanning (see Fig. 14-1B). Cardiac motion may
be visible with transvaginal imaging when the length o the
embryo is 2 mm and should be visible at 7 mm in a live embryo
(American College o Obstetricians and Gynecologists, 2020).
I an embryo measures <7 mm and has no visible cardiac activity, subsequent examination is recommended in 1 week (American Institute o Ultrasound in Medicine, 2018a). At Parkland
Hospital, rst-trimester demise is diagnosed with transvaginal
ultrasound i the embryo has reached 10 mm and lacks cardiac
motion, taking measurement error into consideration. Criteria to diagnose rst-trimester demise are ound in able 11-2
(p. 202).
A recent addition to the standard rst-trimester examination
is an assessment o selected anatomical components when etal
size permits. Tese include the calvarium, umbilical cord insertion into the ventral wall, and presence o extremities (American Institute o Ultrasound in Medicine, 2018a).
■ Nuchal Translucency
Tis represents the maximum thickness o the subcutaneous
translucent area between the skin and sot tissue overlying the
etal spine at the back o the neck. Te nuchal translucency
(N) is measured in the sagittal plane between 11 and 14
weeks’ gestation using precise criteria (Table 14-4) (American
Institute o Ultrasound in Medicine, 2018a; International Society o Ultrasound in Obstetrics and Gynecology, 2016). When
the N measurement is increased, the risk or etal aneuploidy
and various structural anomalies—in particular heart deects—
is signicantly elevated. It is a component o rst-trimester
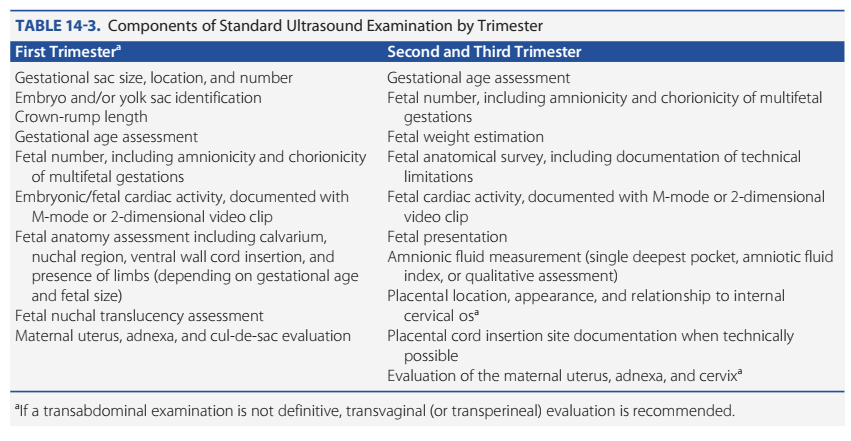
TABLE 14-3. Components of Standard Ultrasound Examination by Trimester
First Trimestera Second and Third Trimester
Gestational sac size, location, and number
Embryo and/or yolk sac identification
Crown-rump length
Gestational age assessment
Fetal number, including amnionicity and chorionicity
of multifetal gestations
Embryonic/fetal cardiac activity, documented with
M-mode or 2-dimensional video clip
Fetal anatomy assessment including calvarium,
nuchal region, ventral wall cord insertion, and
presence of limbs (depending on gestational age
and fetal size)
Fetal nuchal translucency assessment
Maternal uterus, adnexa, and cul-de-sac evaluation
Gestational age assessment
Fetal number, including amnionicity and chorionicity of multifetal
gestations
Fetal weight estimation
Fetal anatomical survey, including documentation of technical
limitations
Fetal cardiac activity, documented with M-mode or 2-dimensional
video clip
Fetal presentation
Amnionic fluid measurement (single deepest pocket, amniotic fluid
index, or qualitative assessment)
Placental location, appearance, and relationship to internal
cervical osa
Placental cord insertion site documentation when technically
possible
Evaluation of the maternal uterus, adnexa, and cervixa
aIf a transabdominal examination is not definitive, transvaginal (or transperineal) evaluation is recommended.

TABLE 14-2. Indications for First-Trimester Ultrasound
Examination
Confirm an intrauterine pregnancy
Estimate gestational age
Confirm cardiac activity
Diagnose/evaluate a multifetal gestation, including
chorionicity and amnionicity
Assess for certain fetal anomalies, such as anencephaly
Measure fetal nuchal translucency, when part of an
aneuploidy screening program
Evaluate for uterine abnormalities or pelvic masses
Evaluate for suspected ectopic pregnancy
Evaluate for suspected gestational trophoblastic
disease
Evaluate for the cause of vaginal bleeding
Evaluate for the cause of pelvic pain
Serve as adjunct to embryo transfer, chorionic villus
sampling, and intrauterine device localization and
removal250 The Fetal Patient
Section 6
TABLE 14-5. Indications for Standard Second- and
Third-trimester Ultrasound Examinations
Routine evaluation of gestational age and fetal anatomya
Fetal growth evaluation or size-date discrepancy
Fetal abnormality (follow-up evaluation)
Amniocentesis or other procedure
Cervical length assessment
Multifetal gestation
Vaginal bleeding
Placenta previa or low-lying placentab
Vasa previab
Placenta accreta spectrumb
Placental abruptionb
Uterine or adnexal abnormalityb
Gestational trophoblastic diseaseb
Amnionic fluid volume abnormalityb
Preterm rupture of membranes or preterm labor
Inability to document fetal heart tones
Assessment of fetal well-being
Assessment of fetal presentation
Adjunct to external cephalic version
aStandard ultrasound examination should be offered in all
pregnancies, ideally at 18–20 weeks’ gestation.
bIncludes evaluation of suspected cases.

TABLE 14-4. Guidelines for Nuchal Translucency (NT)
Measurement
Angle of insonation is perpendicular to NT line
Fetus is measured in midsagittal plane, with nasal tip,
palate, and diencephalon visible
Margins of NT edges are visible
Majority of image is filled by the fetal head, neck, and
upper thorax
Fetal neck lies in a neutral position, not flexed or
hyperextended
Amnion line must be separate from the NT line
+ calipers are placed perpendicular to the fetal long axis,
on the inner borders of the nuchal membranes, with
none of the horizontal crossbar protruding into the
space
Measurement should be obtained at the widest NT space
Largest of 3 NT measurements should be used
SECOND- AND THIRD-TRIMESTER
ULTRASOUND
Ultrasound should be routinely oered to all pregnant
women between 18 and 22 weeks’ gestation (American College o Obstetricians and Gynecologists, 2020). Recognizing
that the gestational age at which an abnormality is identied
may aect pregnancy management options, providers oten
opt to perorm the examination beore 20 weeks. Indications or second- and third-trimester sonograms are listed in

Table 14-5 (American College o Obstetricians and Gynecologists, 2020; American Institute o Ultrasound in Medicine, 2018a). Based on data rom large insurance providers,
pregnant women typically receive at least 4 to 5 sonograms
per pregnancy (O’Keee, 2013). Examinations are classied
as standard, specialized, or limited. Specialized examination
types include the detailed etal anatomy examination, detailed
evaluation or placenta accreta spectrum (p. 253), etal echocardiography, Doppler velocimetry (p. 262), and the biophysical prole (Chap. 20, p. 389).
■ Standard Second and ThirdTrimester
Ultrasound Examinations
Te standard examination includes evaluation o etal number
and presentation, cardiac activity, etal biometry, amnionic
uid volume, placental location, cervical length, and a survey
o etal anatomy (see able 14-3). Anatomical components are
listed in able 15-1 (p. 273). With twins or other multiples,
documentation should also include the number o chorions
aneuploidy screening, which is discussed in Chapter 17
(p. 337). Te aneuploidy risk calculation depends on the
crown-rump length. However, an N measurement ≥3 mm
is associated with increased risk or etal structural or genetic
abnormalities and is an indication or a detailed etal anatomical survey.
■ Detailed FirstTrimester Ultrasound
Examination
Assessment or etal abnormalities in an at-risk pregnancy may
include a detailed survey o etal anatomy at 12 to 14 weeks’
gestation. Such examinations are a recent addition and limited
to specialized centers with advanced imaging skills, although
use may be expected to expand. Despite improvements in imaging technology, it is not realistic to expect that all major abnormalities detectable in the second trimester may be visualized in the
rst trimester. Abnormalities may change in appearance as the
etus develops, and new ndings may become evident. I an
abnormality is identied in the rst trimester, detailed secondtrimester sonography will be important to urther characterize
the ndings or identiy associated abnormalities. In an at-risk
pregnancy, a normal rst-trimester examination does not obviate the recommendation or a detailed second-trimester etal
anatomical survey.
In a systematic review o more than 118,000 pregnancies
undergoing etal N assessment, 46 percent o major abnormalities were detected in low-risk or unselected pregnancies
(Karim, 2017). In high-risk pregnancies, anomaly detection
exceeded 60 percent. Detection rates are high or etal anencephaly, alobar holoprosencephaly, and ventral wall deects.
However, in one series o 40,000 pregnancies with etal anatomical evaluation at the time o N assessment, only a third
o major cardiac anomalies were identied. No cases o microcephaly, agenesis o the corpus callosum, cerebellar abnormalities, congenital pulmonary airway malormations, or bowel
obstruction were detected (Syngelaki, 2011). Some o these
abnormalities had not yet developed by the end o the rst
trimester, and this is an important caveat or counseling.Obstetrical Imaging 251
CHAPTER 14
and amnions, comparison o etal sizes, estimation o amnionic
uid volume within each sac, and etal phenotypic gender.
Te American Institute o Ultrasound in Medicine (2018a)
revised its prior 2013 standard ultrasound practice parameter to
include the ollowing updates:
1. Components added to the standard etal anatomical survey
are presence o the hands and eet, and when easible, the
three-vessel view and three-vessel trachea views o the heart
(Fig. 15-37, p. 290).
2. I the relationship between placenta and cervix cannot be
assessed transabdominally, transvaginal evaluation should be
perormed. ransperineal evaluation remains an option but
in our experience is rarely used.
3. I the cervix appears abnormal or is not adequately visualized
transabdominally, transvaginal (or transperineal) examination
is recommended. I cervical length assessment is requested,
measurement should be based on a transvaginal image.
4. In the setting o velamentous cord insertion, color and
pulsed Doppler ultrasound should be used to evaluate or
vasa previa (Figs. 6-6 and 6-7, p. 115).
■ Detailed Second and ThirdTrimester
Ultrasound Examinations
Te detailed etal anatomy examination is also known as a targeted or 76811 examination. It is perormed when the risk or a
etal structural or genetic abnormality is elevated because o history, screening test result, or abnormal nding during standard
examination (Table 14-6) (American Institute o Ultrasound
in Medicine, 2019). Te detailed ultrasound examination is
intended to be indication-driven and is not repeated without an
extenuating circumstance, such as a new risk actor (American
Institute o Ultrasound in Medicine, 2019). Physicians who
perorm or interpret these ultrasound examinations should
have gained expertise in etal imaging through both training
and ongoing experience (American College o Obstetricians
and Gynecologists, 2020).
Components o the detailed examination are intended to
be determined on a case-by-case basis. able 15-1 (p. 273)
lists nearly 70 anatomical components that may be included.
When practices apply or adjunct accreditation in perormance
o the detailed etal anatomic survey, the American Institute o
Ultrasound in Medicine species 50 components that must be
included when submitting normal cases or review. At Parkland
Hospital, we attempt to image these components in all detailed
anatomic surveys. When perorming a given detailed examination, one challenge is determining which components are
needed or a given indication, as these have not been codied.
Te most prevalent risk actors and thus indications or detailed
ultrasound examinations are maternal obesity and maternal
age ≥35 years. In a systematic review o more than 16,000
pregnancies aected by anomalies, obesity conerred modestly

TABLE 14-6. American Institute for Ultrasound in Medicine Indications for Detailed
Second- and Third-trimester Ultrasound Examinations
Prior fetus or infant with a structural or genetic abnormality
Current pregnancy with known or suspected fetal abnormality or growth restriction
Increased risk for fetal structural abnormality in current pregnancy
Teratogen exposure (Chap. 8)
Diabetes diagnosed before 24 weeks’ gestation
Nuchal translucency ≥3.0 mm
Abnormal serum analyte levels (e.g., elevated alpha fetoprotein)
Assisted reproductive technology used to achieve conception
Prepregnancy body mass index ≥30 kg/m2
Multifetal gestation
Increased risk for fetal genetic abnormality in current pregnancy
Woman or her partner carries a genetic abnormality
Maternal age ≥35 years at delivery
Nuchal translucency ≥3.0 mm
Abnormal aneuploidy screening test result (Chap. 17, p. 333)
Minor aneuploidy marker found during standard ultrasound examination
Other condition affecting the fetus
Congenital infection (Chaps. 67, 68)
Substance abuse
Alloimmunization (Chap. 18, p. 352)
Amnionic fluid volume abnormality
Suspected placenta accreta spectrum or associated risk factors
Adapted with permission from American Institute of Ultrasound in Medicine (AIUM):
Practice parameter for the performance of detailed second- and third-trimester diagnostic
obstetric ultrasound examinations. J Ultrasound Med 38(12):3093, 2019.252 The Fetal Patient
Section 6
increased odds o a neural-tube deect (1.9), ventriculomegaly
(1.7), cardiovascular anomaly (1.3), clet lip/palate (1.2), anorectal atresia (1.5), and limb reduction deect (1.7) (Stothard,
2009). Subsequently, Biggio and colleagues (2010) reported
that obesity was associated with a higher anomaly prevalence
only in the setting o diabetes. Maternal age ≥35 years is considered another indication or detailed sonographic examination. However, the etal anomaly risk may be related to the
associated increase in aneuploidy. Goetzinger and colleagues
(2017) ound that the anomaly rate among euploid etuses
born to older mothers was not increased.
■ Fetal Echocardiography
Tis specialized examination o etal cardiac structure and unction is designed to identiy and characterize abnormalities.
Echocardiography indications include suspected etal cardiac
structural or unctional abnormality; heart rate abnormality or
arrhythmia; extracardiac anomaly or hydrops; chromosomal
abnormality; nuchal translucency ≥3.5 mm; in vitro ertilization; monochorionic twin gestation; rst-degree relative to the
etus with a congenital cardiac deect; rst- or second-degree
relative to the etus with a Mendelian syndrome and childhood
cardiac maniestation; prior etus with heart block in the setting
o maternal anti-Ro or La antibodies; retinoid exposure; and
metabolic risk actor such as pregestational diabetes or phenylketonuria (American Institute o Ultrasound in Medicine, 2020a).
Selected cardiac anomalies are reviewed in Chap. 15 (p. 291).
■ Limited Ultrasound Examination
A limited second- or third-trimester examination is perormed
to address a specic clinical question. Evaluation o etal number, presentation, and cardiac activity; amnionic uid volume;
and placental location with respect to the internal os are common indications (American Institute o Ultrasound in Medicine, 2018b). Te examination may include etal biometry but
not a complete anatomical survey. In the absence o an emergency, a limited examination is perormed only i a standard
ultrasound survey has already been completed. Otherwise, provided that the gestational age is at least 18 weeks, a standard
ultrasound examination is recommended.
■ Fetal Anomaly Detection
With current advances in imaging technology, approximately
60 percent o major etal abnormalities may be detected during standard ultrasound examinations (Byrne, 2020; Rydberg,
2017). For detailed ultrasound surveys perormed in pregnancies at increased risk or anomalies, detection rates may exceed
90 percent (Dashe, 2009; Levi, 1998). Te sensitivity o the
examination varies according to actors such as gestational age,
maternal habitus, etal position, equipment eatures, examination type, operator skill, and the specic abnormality. For
example, maternal obesity lowers the anomaly detection rate by
20 percent (Dashe, 2009).
Detection rates vary considerably according to the abnormality. In the EUROCA network o 28 population-based
registries, 40 percent o major etal abnormalities are detected
prenatally (EUROCA, 2019). Detection rates o selected
abnormalities are as ollows: anencephaly, 98 percent; spina
bida, 89 percent; hydrocephaly, 82 percent; clet lip/palate,
70 percent; hypoplastic let heart, 88 percent; transposition o
the great vessels, 69 percent; diaphragmatic hernia, 73 percent;
gastroschisis, 92 percent; omphalocele, 90 percent; bilateral
renal agenesis, 94 percent; posterior urethral valves, 80 percent;
limb reduction deects, 60 percent; and cluboot, 60 percent.
In contrast, anomalies with poor sonographic detection rates
in the second trimester include microcephaly, choanal atresia,
clet palate, Hirschsprung disease, anal atresia, and congenital
skin disorders. Although clinicians tend to ocus on abnormalities amenable to sonographic detection, those that are undetectable can be no less devastating to amilies. Every sonographic
examination should include a rank discussion o examination
limitations.
■ ThreeDimensional Ultrasound Examination
Over the past three decades, three-dimensional (3-D) ultrasound has gone rom a novelty to a eature o all modern
equipment. Ater a region o interest is identied, a volume is
acquired using a 3-D transducer. Tis volume can be rendered
to display axial, sagittal, coronal, or oblique images. Sequential slices may be generated, similar to computed tomographic
(C) images. Unlike two-dimensional (2-D) scanning, which
appears to be happening in real time on the screen, 3-D imaging is static and obtained by processing a volume o stored
images. With our-dimensional ultrasound, rapid reconstruction
o the rendered images conveys the impression that the scanning is in real time.
For selected anomalies, such as those o the ace and skeleton, or tumors, and or some cases o neural-tube deects, 3-D
sonography can add useul inormation (American College o
Obstetricians and Gynecologists, 2020; Goncalves, 2005). Tat
said, comparisons o 3-D and conventional 2-D sonography or
the diagnosis o most congenital anomalies have not demonstrated better overall detection rates (Goncalves, 2006; Reddy,
2008). Te American College o Obstetricians and Gynecologists (2020b) has concluded that proo o a clinical advantage
o 3-D ultrasound or prenatal diagnosis is generally lacking.
PLACENTA AND CERVIX
Te standard examination includes evaluation o the anatomical relationship between the placenta and the internal cervical
os, the umbilical cord insertion into the placenta, and cervical length assessment. (American Institute o Ultrasound in
Medicine, 2018a). Evaluation or placenta accreta spectrum is
a detailed examination type (see able 14-6).
■ Placenta Previa and Lowlying Placenta
Te location o the placenta with respect to the cervix may
be accurately assessed by approximately 16 weeks’ gestation. I transabdominal visualization is limited, transvaginal
ultrasound is recommended. Placenta previa is diagnosed i
the placenta overlies the internal cervical os to any degree orObstetrical Imaging 253
CHAPTER 14
reaches its margin (Fig. 14-2A). I the inerior placental edge
is within 2 cm o the internal os but does not reach the cervix,
the diagnosis is low-lying placenta (see Fig. 14-2B). Whenever
placenta previa or low-lying placenta are diagnosed, a ollowup ultrasound examination is recommended at approximately
32 weeks’ gestation, with transvaginal evaluation i needed to
veriy the relationship between the placenta and cervix. I ndings persist, a 36-week ultrasound examination also is recommended. Management o these placenta types are discussed in
Chapter 43 (p. 757).
Te umbilical cord insertion into the placenta should be
interrogated. Marginal cord insertion, also known as battledore
placenta, is diagnosed i the umbilical cord inserts into the edge
o the placenta or within 2 cm o the placental margin. I the
umbilical cord does not insert into the placenta—but rather
into the membranes—the diagnosis is velamentous cord insertion
(Fig. 6-6, p. 115). With the latter, the umbilical arteries and
vein traverse the membranes along the uterine wall unprotected
by Wharton jelly beore entering the placental margin. I umbilical vessels course within the portion o membrane overlying the
cervix or within 2 cm o the cervix, the diagnosis is vasa previa
(Fig. 6-7, p. 116). Vasa previa may also occur i there are two
or more placental lobes—as with a succenturiate lobe—and the
interconnecting vessels traverse the intervening membranes over
or in proximity to the internal cervical os. ransvaginal ultrasound with color Doppler highlights the vessels, and pulsedwave Doppler o the spanning arterial vessel demonstrates a etal
heart rate, which conrms the diagnosis. A subsequent detailed
ultrasound examination is recommended at 32 weeks’ gestation (Society or Maternal-Fetal Medicine, 2015b). Chapter 6
(p. 114) contains content on management o these entities.
■ Placenta Accreta Spectrum
Placenta accreta, increta, and percreta comprise the placenta
accreta spectrum (PAS). Tey are characterized by abnormal placental invasion onto, into, or through the myometrium, respectively (Chap. 43, p. 759). Evaluation includes transabdominal
and transvaginal imaging, with and without color or power
Doppler and with the patient’s bladder partially lled. In one
metaanalysis that included more than 3200 pregnancies, the
sensitivity o ultrasound to identiy placenta accreta, increta,
and percreta was 91, 93, and 89 percent, respectively. Corresponding specicities were 97, 98, and 99 percent, respectively
(Pagani, 2018). Five ultrasound criteria assist with detection
and characterization o PAS (Fig. 14-3):
1. Placental lacunae, which are vascular spaces that may contain
prominent color Doppler ow
2. Attenuation or thinning o the retroplacental myometrium,
such that the smallest myometrial thickness measurement is
<1 mm. Tis is also reerred to as loss o the retroplacental
clear space
3. Disruption o the bladder-uterine serosal interace, which
appears as an irregular, echogenic boundary between the
bladder and uterine serosa with gray-scale imaging
4. Bridging vessels, which are demonstrated with color Doppler
to course rom the placenta to the bladder-serosal interace
5. A placental “bulge” that pushes outward and distorts the
contour o the uterus or other organs. In some cases o placenta percreta, a ocal exophytic mass also is seen.
Te accuracy o these criteria varies in published series
and is aected by the number and predictive value o given
ndings and by associated risk actors such as placenta previa
and number o prior cesarean deliveries (Jauniaux, 2016; Rac,
2015). Serial evaluation may be helpul, particularly in the
third trimester. With concurrent placenta previa and history o
cesarean delivery, any o these ultrasound ndings prompts a
detailed ultrasound evaluation. Te role o magnetic resonance
(MR) imaging as an adjunct in pregnancies with suspected PAS
is reviewed later (p. 268).
■ Cesarean Scar Pregnancy
Placental implantation within a prior hysterotomy scar—
termed cesarean scar pregnancy (CSP)—is oten a precursor
A B

FIGURE 14-2 A. Placenta previa. In this transvaginal image, the inferior edge (arrow) of the posterior placenta (P) overlies the internal
cervical os (arrowhead). H = head. B. Low-lying placenta. The inferior placental edge (arrow) is within 2 cm of the internal cervical os (arrowhead) in this transvaginal image. The bladder (B) is seen anterior to the cervix.254 The Fetal Patient
Section 6
to second- or third-trimester PAS (Happe, 2020; Rac, 2016;
imor-risch, 2014). Sonographically, the gestational sac
lies low and anteriorly in the uterus. CSPs may appear to
rest on the prior scar or may ll the niche, which is a myometrial pocket deect in the thinned hysterotomy scar (Kaelin Agten, 2017). Placental sonolucencies, a precursor to
PAS lacunae, may be seen. Te retroplacental myometrium
may be attenuated to a degree that the distance rom the
anterior trophoblastic border to the uterine serosa measures
<3 mm (D’Antonio, 2018; Moschos, 2014; Happe, 2020).
Color Doppler may demonstrate prominent vascularity
in the region o the prior hysterotomy scar (Fig. 14-4). In
some cases, the gestational sac may bulge toward the bladder.
CSP evaluation and management are discussed in Chapter
12 (p. 229).
■ Cervical Length
Although the cervix may be imaged transabdominally
(Fig. 14-5A), visualization is oten limited by maternal habitus,
cervical position, or shadowing by the etal presenting part. In
addition, the maternal bladder or pressure rom the transducer
may articially elongate the cervix’s appearance. As a result,
values rom transabdominal or transvaginal measurement o the
cervix can dier signicantly.
I the cervix appears short or is inadequately visualized during transabdominal evaluation, transvaginal assessment should
be considered (American Institute o Ultrasound in Medicine,
2018a). Clinical decision-making should use only cervical
length measurements obtained transvaginally (Fig. 14-5B).
Measurement should be perormed at or beyond 16 weeks’
gestation. A short cervix is associated with an elevated risk or
preterm birth, particularly in those with prior preterm birth.
Risk rises proportionally with the degree o cervical shortening
(Chap. 45, p. 793).
o measure the cervix transvaginally, the imaging criteria shown in Table 14-7 are ollowed. Te endocervical canal
should be visible in its entirety, and images ideally are obtained
over several minutes to capture dynamic change. Funneling is a
protrusion o amnionic membranes into a portion o the endocervical canal that has dilated (Fig. 14-6). Funneling is not an
independent predictor o preterm birth but is associated with
cervical shortening. ransvaginal assessment is recommended
i a unnel is suspected transabdominally. Te cervical length is
measured distal to the unnel, because the unnel’s base becomes
the unctional internal os. I the cervix is dilated, as with cervical
insufciency, the membranes may prolapse through the endocervical canal and into the vagina to produce an hourglass appearance. Sludge represents an aggregate o particulate matter (debris)
within the amnionic sac and close to the internal os. In pregnancies at risk or preterm birth, sludge urther raises the risk.
AMNIONIC FLUID
■ Physiology
Amnionic uid serves several roles. Fetal breathing is essential or normal lung growth, and etal swallowing permits
A B C
FIGURE 14-3 These third-trimester sonograms demonstrate findings that characterize placenta accreta spectrum. A. Transabdominal color mapping depicts bridging vessels between the bladder
and the uterine serosa (arrowheads) and shows large intraplacental
lacunae (arrow). B. Transvaginal transverse image showing a large
bulge (suggesting placenta percreta) along the bladder-uterine
serosal interface (arrowheads) and multiple large, irregular lacunae (arrows). C. Disruption of the bladder-serosal interface. The
echogenic interface between bladder and serosa appears irregular
(arrowheads). The smallest myometrial thickness measures <1 mm,
and bridging vessels are highlighted by color Doppler. Large lacunae also are shown (arrows).Obstetrical Imaging 255
CHAPTER 14
A B
C D

FIGURE 14-4 Cesarean scar pregnancy, transvaginal images. A. The trophoblast appears to fill the scar “niche” (arrows). B. Outward
bulging of the gestational sac toward the bladder (arrowheads). C. Placental sonolucencies (arrows). D. Attenuation of the retroplacental
myometrium. The distance from the anterior trophoblastic border to the uterine serosa is <1 mm (arrows). Color Doppler demonstrates
vascularity in the region of the prior hysterotomy scar.
A B

FIGURE 14-5 A. Transabdominal image of the cervix depicting the internal os and external os. B. Transvaginal imaging provides a more
accurate evaluation of the cervix and should be used for medical decision-making. In this image, arrowheads mark the endocervical canal.
(Reproduced with permission from Dr. Emily Adhikari.)256 The Fetal Patient
Section 6
Early in pregnancy, amnionic uid is similar in composition
to extracellular uid. Amnionic uid arises as a transudate o
plasma either rom the etus through its nonkeratinized skin
or rom the mother across the uterine decidua and placenta
surace (Beall, 2007). Specically, early transer o water and
other small molecules occurs via three mechanisms: across the
amnion—transmembranous fow; across etal vessels on the placental surace—intramembranous fow; and across etal skin—
transcutaneous fow. Fetal urine production does not become a
major component o amnionic uid until the second trimester, which explains why etuses with lethal renal abnormalities
may not maniest severe amnionic volume declines until ater
18 weeks’ gestation. Water transport across the etal skin continues until keratinization occurs at 22 to 25 weeks. In the second hal o pregnancy, etal urination is the primary source
o amnionic uid. In late gestation, the etal respiratory tract
also produces approximately 350 mL o lung uid per day.
Fetal swallowing is the primary mechanism or amnionic uid
resorption and averages 500 to 1000 mL per day (Mann, 1996).
By term, the entire amnionic uid volume is recirculated on a
daily basis (Table 14-8). However, impaired swallowing, secondary to either a central nervous system (CNS) abnormality
or GI tract obstruction, can result in impressive amnionic uid
volume expansion.
Te osmolality o amnionic uid is similar to that o etal
urine and hypotonic to that o maternal and etal plasma. Specically, the osmolality o maternal and etal plasma approximates 280 mOsm/mL, whereas that o amnionic uid is about

FIGURE 14-6 Transvaginal image depicting a foreshortened
cervix with funneling. Funneling is a protrusion of amnionic membranes into a portion of the endocervical canal that has dilated.
The distal protruding edge of the funnel becomes the functional
internal os (left arrow). Thus, the measured cervical length, which lies
between the arrows, should not include the funnel. (Reproduced
with permission from Dr. Emily Adhikari.)

TABLE 14-7. Criteria for Transvaginal Evaluation of the Cervix
Imaging the Cervix
Maternal bladder should be empty.
Transducer is inserted under real-time observation, identifying midsagittal plane, internal os, and then external os, while
keeping the internal os in view.
Internal os, external os, and entire endocervical canal should be visible. The internal os may appear as a small triangular
indentation at the junction of the amnionic cavity and endocervical canal.
Image is enlarged so that the cervix fills approximately 75% of the screen.
Anterior and posterior width of the cervix should be approximately equal.
Transducer is pulled back slightly until the image begins to blur, ensuring that pressure is not placed on the cervix, then
inserted only enough to restore a clear image.
Images should be obtained with and without fundal or suprapubic pressure, to assess for dynamic change or shortening
on real-time imaging.
Measuring the Cervix
Calipers are placed at the point where anterior and posterior walls of cervix meet.
Endocervical canal appears as a faint, linear echodensity.
If canal has a curved contour, a straight line between the internal and external os will deviate from the path of the
endocervical canal.
If midpoint of the line between the internal and external canal deviates by ≥3 mm from the endocervical canal, measure
the cervical length in two linear segments.
Funneling, sludge (debris), or dynamic change is noted.
At least three separate images are measured during a period of at least 3 minutes to allow for dynamic change.
Visualization of cervical shortening on real-time imaging, with or without fundal or suprapubic pressure, raises preterm
birth risks.
Shortest cervical length image that meets all criteria should be used.
Adapted from American Institute of Ultrasound in Medicine, 2018a; Iams, 2013.
gastrointestinal (GI) tract development. Te uid also creates a
physical space or etal movement, which is necessary or neuromusculoskeletal maturation. Amnionic uid urther guards
against umbilical cord compression and protects the etus rom
trauma. It also has bacteriostatic properties.Obstetrical Imaging 257
CHAPTER 14
260 mOsm/L. Te hypotonicity o amnionic uid accounts or
up to 400 mL per day o intramembranous uid transer across
and into etal vessels on the placental surace (Mann, 1996).
Maternal dehydration can lead to higher maternal osmolality,
which avors uid transer rom the etus to mother and then
rom the amnionic uid compartment into the etus (Moore,
2010).
Amnionic uid volume expands rom approximately 30 mL
at 10 weeks’ gestation to 200 mL by 16 weeks and reaches
800 mL by the mid-third trimester (Brace, 1989; Magann,
1997). Using dye dilution, Magann and associates (1997)
reported that the average amnionic uid volume was approximately 400 mL between 22 and 30 weeks’ gestation, then rose
to 800 mL until 40 weeks, and subsequently declined by 8
percent per week. Tere was a wide normal range, particularly
in the third trimester. Abnormally decreased uid volume is
termed oligohydramnios, whereas abnormally increased uid
volume is termed hydramnios or polyhydramnios.
■ Semiquantitative Assessment
Evaluation o amnionic uid volume is a component o every
second- or third-trimester ultrasound examination. Volume is
measured semi-quantitatively using the single deepest pocket o
uid or the amnionic uid index (AFI). Both measurements are
reproducible and, in the setting o a uid abnormality, can be
ollowed serially over time to assess trends and aid communication among providers. For this reason, subjective assessment
alone is not recommended.
Te single deepest pocket o uid is measured in a sagittal plane with the ultrasound transducer held perpendicular to
the oor and parallel to the long axis o the woman. A pocket
should be at least 1 cm wide to be considered adequate, and the
measurement should not include etal parts or loops o umbilical cord. Color Doppler is generally used to veriy that umbilical cord is not within the measurement. Te measurement is
considered normal i it is >2 cm and <8 cm. Values below and
above this range indicating oligohydramnios and hydramnios,
respectively. Tese thresholds correspond to the 3rd and 97th
percentiles (Chamberlain, 1984). When evaluating twins and
other multietal gestations, a single deepest pocket is assessed in
each gestational sac, using the same normal range (Hernandez,
2012; Society or Maternal-Fetal Medicine, 2013). Te etal
biophysical prole similarly uses a single deepest vertical pocket
threshold o >2 cm to indicate normal amnionic uid volume
(Chap. 20, p. 389).
o measure the AFI, the uterus is divided into our equal
quadrants—the right and let upper and lower quadrants,
respectively. Te AFI is the sum o the single deepest pocket
rom each quadrant. In a study o 1400 measurements obtained
rom the INERGROWH-21st trial, the mean intra- and
interobserver variability o AFI measurements were each below
1 cm (Sande, 2015). wo standard deviations rom the mean,
however, reached 5 and 7 cm, respectively. As useul rule o
thumb, the AFI is generally three times higher than the single
deepest pocket o uid.
Te AFI is considered normal i >5 cm and <24 or 25 cm.
Using an AFI nomogram based on cross-sectional evaluation o
nearly 800 uncomplicated pregnancies, the mean AFI ranged
between 12 and 15 cm rom 16 weeks until 40 weeks’ gestation
(Moore, 1990). Other investigators have published nomograms
with similar mean values (Fig. 14-7) (Hinh, 2005; Machado,
2007).
■ Hydramnios
Abnormally increased amnionic uid volume complicates 1 to
2 percent o singleton pregnancies (Dashe, 2002; Khan, 2017;
Pri-Paz, 2012). Hydramnios may be categorized as mild i the
AFI is 25 to 29.9 cm; moderate, i 30 to 34.9 cm; and severe,
i ≥35 cm (Luo, 2017; Odibo, 2016). Using a single deepest
pocket o amnionic uid, as is done in multietal gestations,
mild hydramnios is dened as 8 to 9.9 cm, moderate as 10 to
11.9 cm, and severe hydramnios as ≥12 cm (Fig. 14-8). Mild
hydramnios accounts or approximately two thirds o cases and
is requently idiopathic and benign. By comparison, severe
hydramnios is ar more likely to have an underlying etiology
and to have consequences or the pregnancy.
Underlying causes o hydramnios include etal structural
abnormalities or genetic syndromes in approximately 15 percent and diabetes in 15 to 20 percent (Table 14-9). Selected
anomalies and the likely mechanism by which they cause
hydramnios are shown in Table 14-10. Congenital inection,
red blood cell alloimmunization, and placental chorioangioma
are less requent etiologies. Hydramnios may also complicate
syphilis and cytomegalovirus, toxoplasmosis, and parvovirus
inections (Chaps. 67 and 68, pp. 1183 and 1206). Hydramnios is oten seen with hydrops etalis (Chap. 18, p. 360). Te

TABLE 14-8. Amnionic Fluid Volume Regulation in Late Pregnancy
Pathway
Effect on
Volume
Approximate Daily
Volume (mL)
Fetal urination Production 1000
Fetal lung fluid secretion Production 350
Fetal swallowing Resorption 750
Intramembranous flow across fetal vessels on the
placental surface
Resorption 400
Transmembranous flow across amnionic membrane Resorption Minimal
Data from Magann, 2011; Modena, 2004; Moore, 2010.258 The Fetal Patient
Section 6
and 10 percent i hydramnios
was severe. Te overall reported
risk that an underlying anomaly
will be discovered ater delivery
ranges rom 9 percent in the
neonatal period to 28 percent
among inants ollowed to 1
year o age (Abele, 2012; Dorleijn, 2009).
Te amnionic uid glucose concentration is higher in
diabetic women than in those
without diabetes, and the AFI
may correlate positively with the
amnionic uid glucose concentration (Dashe, 2000; Spellacy,
1973; Weiss, 1985). Such ndings support the hypothesis that
maternal hyperglycemia causes
etal hyperglycemia, which leads
to etal osmotic diuresis into the
amnionic uid compartment.
Repeat screening or gestational
diabetes in pregnancies with
hydramnios does not appear to
be benecial i the second-trimester glucose tolerance test result
was normal (Frank Wol, 2017).
Hydramnios is more requently noted in multietal gestations than in singleton ones. In a review o nearly 2000
twin gestations, Hernandez and coworkers (2012) identied
hydramnios in 18 percent o both monochorionic and dichorionic pregnancies. In monochorionic gestations, hydramnios
in one sac and oligohydramnios in the other are diagnostic criteria or twin-twin transusion syndrome (S) (Chap. 48,
p. 848). Isolated hydramnios solely in one sac also may precede
this syndrome’s development (Chon, 2014). In the absence o a
etal abnormality or S, complication risks are not generally
higher (Hernandez, 2012).
Idiopathic hydramnios is a diagnosis o exclusion. It accounts
or up to 70 percent o all hydramnios cases, is mild in approximately 80 percent o idiopathic cases, and subsequently resolves
in more than one third (Odibo, 2016; Wiegand, 2016).
Management
Severe hydramnios occasionally results in early preterm labor or
maternal respiratory compromise. In such cases, large-volume
amniocentesis—termed amnioreduction—may be needed. Te
technique is similar to that or genetic amniocentesis but is generally done with an 18- or 20-gauge needle. Fluid is collected
in either a vacuum container bottle or a larger syringe (Chap.
17, p. 344). Approximately 1000 to 2000 mL o uid is slowly
withdrawn over 20 to 30 minutes, depending on the severity o
hydramnios and gestational age. Te goal is to restore amnionic
uid volume to the upper normal range. Subsequent amnioreduction procedures may be required as oten as weekly or semiweekly.
In a review o 138 singleton pregnancies requiring amnioreduction or hydramnios, a etal GI malormation was identied
in 20 percent, a chromosomal abnormality or genetic condition

FIGURE 14-8 Severe hydramnios. This pocket of amnionic fluid
measured >15 cm, and the amnionic fluid index measured nearly
50 cm.
underlying pathophysiology in such cases is requently related
to a high-cardiac-output state, and severe etal anemia a classic
example. A detailed ultrasound examination is indicated whenever hydramnios is identied. I a etal abnormality is identied
at that time, the aneuploidy risk is signicantly elevated.
Te degree o hydramnios positively correlates with the likelihood o an anomalous etus. At Parkland Hospital, the prevalence o an anomalous neonate approximated 8 percent with
mild hydramnios, 12 percent with moderate hydramnios, and
more than 30 percent with severe hydramnios (Dashe, 2002).
Even i no abnormality was detected during targeted sonographic evaluation, the likelihood o a major anomaly identied
at birth was 1 to 2 percent i hydramnios was mild or moderate
97.5th percentile
50th percentile
2.5th percentile
8 6 4 2 0
10
12
14
16
18
22
26
30
Mild hydramnios
Oligohydramnios
20
24
28
16 18 20 22 24 26 28 30 32 34 36 38 40 42
Weeks’ gestation
Amnionic fluid index (cm)
Moore, 1990 Machado, 2007 Hinh, 2005
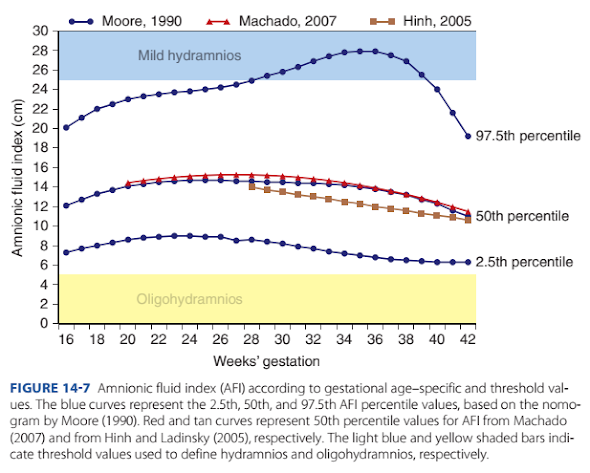
FIGURE 14-7 Amnionic fluid index (AFI) according to gestational age–specific and threshold values. The blue curves represent the 2.5th, 50th, and 97.5th AFI percentile values, based on the nomogram by Moore (1990). Red and tan curves represent 50th percentile values for AFI from Machado
(2007) and from Hinh and Ladinsky (2005), respectively. The light blue and yellow shaded bars indicate threshold values used to define hydramnios and oligohydramnios, respectively.Obstetrical Imaging 259

CHAPTER 14
TABLE 14-10. Selected Anomalies and Mechanism for Hydramnios
Mechanism Anomaly Examples
Impaired swallowing (CNS) Anencephaly
Hydranencephaly
Holoprosencephaly
Impaired swallowing (craniofacial) Cleft lip/palate
Micrognathia
Tracheal compression or obstruction Neck venolymphatic abnormality
CHAOSa
Thoracic etiology (mediastinal shift) Diaphragmatic herniaa
Cystic adenomatoid malformationa
Pulmonary sequestrationa
High-output cardiac state Ebstein anomalya
Tetralogy of Fallot with absent pulmonary valvea
Thyrotoxicosisa
Functional cardiac etiology Cardiomyopathy, myocarditisa
Cardiac arrhythmia Tachyarrhythmiaa: atrial flutter, atrial fibrillation, supraventricular tachycardia
Bradyarrhythmiaa: heart block
GI obstruction Esophageal atresia
Duodenal atresia
Renal-urinary Ureteropelvic junction obstruction (“paradoxical hydramnios”)
Bartter syndrome
Neurological or muscular etiology Arthrogryposis, akinesia sequence
Myotonic dystrophy
Neoplastic etiology Sacrococcygeal teratomaa
Mesoblastic nephromaa
Placental chorioangiomaa
aPoses risk for hydrops.
CNS = central nervous system; CHAOS = congenital high-airway obstruction sequence; GI = gastrointestinal.

TABLE 14-9. Hydramnios: Prevalence and Associated Etiologies—Values in Percent
Golan (1993)
n = 149
Many (1995)
n = 275
Biggio (1999)
n = 370
Dashe (2002)
n = 672
PriPaz (2012)
n = 655
Prevalence 1 1 1 1 2
Amnionic fluid index
Mild 25–29.9 cm
Moderate 30–34.9 cm
Severe >35 cm
— 72
20
8
— 66
22
12
64
21
15
Etiology
Idiopathic
Fetal anomalya
Diabetes
65
19
15
69
15a
18
72
8
20
82
11a
7
52
38a
18
aA significant correlation was identified between severity of hydramnios and likelihood of an anomalous infant.
in almost 30 percent, and a neurological abnormality in 8 percent (Dickinson, 2014). In only 20 percent o cases was the
hydramnios idiopathic. Te initial amnioreduction procedure
was perormed at 31 weeks’ gestation, and the median gestational age at delivery was 36 weeks.
Outcomes
Hydramnios can be associated with preterm birth, placental
abruption, uterine dysunction during labor, and postpartum
hemorrhage. When an underlying cause is identied, the severity o hydramnios positively correlates with risk or preterm
delivery, small-or-gestational age newborn, and perinatal
mortality (Pri-Paz, 2012). However, idiopathic hydramnios is
generally not associated with preterm birth (Magann, 2010;
Many, 1995; Panting-Kemp, 1999). Placental abruption may
result rom rapid decompression o an overdistended uterus
ollowing rupture o membranes or therapeutic amnioreduction, occasionally days or weeks later. Uterine dysunction rom260 The Fetal Patient
Section 6
overdistention may lead to postpartum atony and associated
postpartum hemorrhage.
With idiopathic hydramnios, birthweight exceeds 4000 g in
nearly 25 percent o cases, and the likelihood is greater i the
hydramnios is moderate or severe (Luo, 2017; Odibo, 2016;
Wiegand, 2016). A rationale or this association is that larger
etuses have higher urine output, by virtue o their increased
volume o distribution, and etal urine is the largest contributor to amnionic uid volume. Cesarean delivery rates are also
higher in pregnancies with idiopathic hydramnios, and reported
rates range rom 35 to 55 percent (Dorleijn, 2009; Khan, 2017;
Odibo, 2016).
An unresolved question is whether hydramnios alone raises
the risk or perinatal mortality (Khan, 2017; Pilliod, 2015;
Wiegand, 2016). Using birth certicate data rom Caliornia,
Pilliod and colleagues (2015) reported that at 37 weeks’ gestation, the stillbirth risk was sevenold higher in pregnancies
with hydramnios. Risks appear to be compounded when etalgrowth restriction is comorbid with hydramnios (Erez, 2005).
■ Oligohydramnios
Abnormally decreased amnionic uid volume complicates 1 to
2 percent o pregnancies (Casey, 2000; Petrozella, 2011). Oligohydramnios is diagnosed i the AFI measures <5 cm or the
single deepest pocket is <2 cm (American College o Obstetricians and Gynecologists, 2020). An AFI threshold o 5 cm is
below the 2.5th percentile throughout the second and third
trimesters (see Fig. 14-7). Importantly, use o AFI rather than
single deepest pocket will identiy more pregnancies as having
oligohydramnios but without evidence o improved pregnancy
outcomes (Kehl, 2016; Nabhan, 2010). When evaluating multietal pregnancies or S, a single deepest pocket <2 cm is
used to dene oligohydramnios (American College o Obstetricians and Gynecologists, 2021c). When no measurable pocket
o amnionic uid is identied, the term anhydramnios is used.
By 18 weeks’ gestation, the etal kidneys are the main contributor to amnionic uid volume. Selected renal abnormalities that lead to absent etal urine production include bilateral
renal agenesis, bilateral multicystic dysplastic kidney, unilateral
renal agenesis with contralateral multicystic dysplastic kidney,
and the inantile orm o autosomal recessive polycystic kidney
disease. Lower urinary abnormalities may also cause oligohydramnios because o etal bladder outlet obstruction (Figs.
15-58 through 15-61, p. 300). Complex etal genitourinary
abnormalities such as persistent cloaca and sirenomelia similarly
may result in a lack o amnionic uid. With oligohydramnios beore the mid-second trimester, particularly beore 20 to
22 weeks, pulmonary hypoplasia is a signicant concern. Te
prognosis is extremely poor unless etal therapy is an option
(Chap. 19, p. 377).
Oligohydramnios is also associated with exposure to drugs
that block the renin-angiotensin system. Tese include angiotensin-converting enzyme (ACE) inhibitors, angiotensinreceptor blockers, and nonsteroidal antiinammatory drugs
(NSAIDs). When taken in the second or third trimester, ACE
inhibitors and angiotensin-receptor blockers may result in etal
hypotension, renal hypoperusion, and renal ischemia, leading
to subsequent anuric renal ailure (Bullo, 2012; Guron, 2000).
Fetal skull bone hypoplasia and limb contractures also have
been described (Schaeer, 2003). Additionally, NSAIDs can
be associated with etal ductus arteriosus constriction and
impaired etal urine production (Chap. 8, p. 151).
Oligohydramnios in the late second trimester or in the third
trimester is oten associated with uteroplacental insufciency.
A placental abnormality or a maternal complication such as
preeclampsia or vascular disease are examples. Initially, ruptured membranes should be excluded. Ten, particularly in
the second trimester, a detailed ultrasound examination should
be perormed to search or etal and placental abnormalities.
I a placental hematoma or chronic abruption is sufciently
severe to result in oligohydramnios—the chronic abruptionoligohydramnios sequence (CAOS)—then it commonly also
causes growth restriction (Chap. 43, p. 750).
Management
Oligohydramnios detected beore 36 weeks’ gestation in the
presence o normal etal anatomy and growth is generally managed expectantly and coupled with etal surveillance (Chap. 20,
p. 392). For late-preterm and early-term pregnancies, risks o
etal compromise outweigh potential complications o preterm
delivery. Te American College o Obstetricians and Gynecologists (2021b) recommends delivery between 360/7 and 376/7
weeks. In a review o 16 trials o pregnancies with apparent
isolated oligohydramnios, oral or intravenous hydration was
associated with a signicantly improved AFI. However, it was
unclear whether this translated into better pregnancy outcomes
(Gizzo, 2015).
Outcomes
In a review o pregnancies with oligohydramnios at Parkland
Hospital, Petrozella and associates (2011) ound that an AFI
<5 cm identied between 24 and 34 weeks’ gestation was
associated with increased risks or perinatal morbidity and
mortality (Table 14-11). Similarly, a metaanalysis comprising
more than 10,000 pregnancies ound that oligohydramnios
conerred a twoold risk or cesarean delivery due to nonreassuring etal status and a veold risk or an Apgar score <7
at 5 minutes compared with pregnancies with a normal AFI
(Chauhan, 1999).
As discussed, i oligohydramnios is dened as an AFI <5 cm
rather than a single deepest pocket <2 cm, more pregnancies
will be classied as such. Kehl and coworkers (2016) perormed
a prospective trial with more than 1000 term pregnancies in
which women with an AFI <5 cm or a single deepest pocket
<2 cm were randomly assigned to labor induction or expectant
care. Signicantly more pregnancies were diagnosed with oligohydramnios using the AFI criterion—10 percent compared
with just 2 percent—when single deepest pocket was used. Tis
led to a higher rate o labor induction in the AFI group but not
to a dierence in neonatal outcomes.
Borderline Oligohydramnios
Tis diagnosis is somewhat controversial. Also called borderline
AFI. It usually reers to an AFI between 5 and 8 cm (Magann,
2011; Petrozella, 2011). During the mid-third trimester, anObstetrical Imaging 261
CHAPTER 14
AFI value o 8 cm is below the 5th percentile on the Moore
nomogram (see Fig. 14-7). Petrozella (2011) ound that pregnancies between 24 and 34 weeks’ gestation with an AFI
between 5 and 8 cm were not more likely than those with an
AFI >8 cm to have maternal hypertensive complications or an
increased risk or stillbirth and neonatal death. Wood and colleagues (2014) reported a higher rate o etal-growth restriction
in pregnancies with borderline AFI but not an increase in rates
o preterm delivery or need or neonatal intensive care. In a
study o late-preterm pregnancies that were otherwise uncomplicated, borderline AFI conerred no increased risk or preterm
delivery, nonreassuring etal heart rate tracing, low Apgar score,
or neonatal respiratory compromise (Sahin, 2018). Evidence
is insufcient to support etal surveillance or delivery in this
setting (Magann, 2011).
DOPPLER
When sound waves strike a moving target, the requency o
the waves reected back is shited in proportion to the velocity
and direction o that moving target—a phenomenon known
as the Doppler shit. Because magnitude and direction o the
requency shit depend on the motion o a moving target, Doppler can help evaluate ow within blood vessels.
An important component o the Doppler equation is the
angle o insonation, abbreviated as theta (θ) (Fig. 14-9). Tis
is the angle between the sound waves rom the transducer and
ow within the vessel. Measurement error becomes large when
θ is not close to zero, in other words, when blood ow is not
coming directly toward or away rom the transducer. For this
reason, ratios are oten used to compare dierent waveorm
components and allow cosine θ to cancel out o the equation.
Figure 14-10 is a schematic o the Doppler waveorm and
describes the three ratios commonly used. Te simplest is the
systolic-diastolic ratio (S/D ratio), which compares the maximal (or peak) systolic ow with end-diastolic ow to evaluate
downstream impedance to ow. Currently, two types o Doppler modalities are available or clinical use.
Continuous-wave Doppler equipment contains two types
o crystals, one to transmit high-requency sound waves and
another to continuously capture signals. In M-mode imaging,
continuous-wave Doppler is used to evaluate motion through
time, however, it cannot image individual vessels.
Pulsed-wave Doppler uses only one crystal, which transmits
the signal and then waits until the returning signal is received
beore transmitting another one. It allows precise visualization
and color-ow mapping o the vessel o interest. By convention,

TABLE 14-11. Pregnancy Outcomes in Women Diagnosed with Oligohydramnios
between 24 and 34 Weeks’ Gestation at Parkland Hospital
Factor
AFI ≤5 cm
(n = 166)
AFI 8 to 24 cm
(n = 28,185) p Value
Major malformation 42 (25) 634 (2) <.001
Stillbirth 8 (5) 133 (<1) <.001
Gestational age at deliverya 35.1 ± 3.3 39.2 ± 2.0 <.001
Preterm birth, spontaneousa 49 (42) 1698 (6) <.001
Preterm birth, indicateda 23 (20) 405 (2) <.001
Cesarean delivery for nonreassuring fetal
statusa
10 (9) 1083 (4) <.001
Birthweight <10th percentilea 61 (53) 3388 (12) <.001
<3rd percentilea 43 (37) 1130 (4) <.001
Neonatal deatha 1 (1) 24 (<1) <.001b
Data expressed as No. (%) and mean ± standard deviation.
aAnomalous infants excluded.
bThis difference was no longer significant after adjustment for gestational age at delivery.
Data from Petrozella LN, Dashe JS, McIntire DD, et al: Clinical significance of borderline
amniotic fluid index and oligohydramnios in preterm pregnancy. Obstet Gynecol
117(2 pt 1):338, 2011.

FIGURE 14-9 Doppler equation. Ultrasound emanating from the
transducer with initial frequency fo strikes blood moving at velocity v.
Reflected frequency fd is dependent on angle θ between beam of
sound and vessel.262 The Fetal Patient
Section 6
blood owing toward the transducer is displayed in red and
that owing away rom the transducer appears in blue.
■ Umbilical Artery
Te umbilical artery diers rom other vessels in that it normally has orward ow throughout the entire cardiac cycle.
With advancing gestation, the amount o ow during diastole
increases because o decreasing placental impedance. Te S/D
ratio approximates ≤4.0 ater 20 weeks’ gestation, <3.0 ater
30 weeks’, and close to 2.0 at term. More end-diastolic ow is
observed at the placental cord insertion than at the etal ventral wall, a reection o downstream impedance to ow. Tus,
abnormalities such as absent or reversed end-diastolic ow will
appear rst at the cord insertion site into the etus. Te International Society o Ultrasound in Obstetrics and Gynecology
recommends that umbilical artery Doppler measurements be
made in a ree loop o cord (Bhide, 2013). However, assessment close to the ventral wall insertion may optimize measurement reproducibility in cases in which ow is diminished
(Berkley, 2012).
Te waveorm is considered abnormal i the S/D ratio is
>95th percentile or gestational age. Treshold values are listed
in the Appendix (p. 1242). In extreme cases o growth restriction, end-diastolic ow can become absent or even reversed
(Fig. 47, p. 830). Such reversal o end-diastolic ow has been
associated with greater than 70-percent obliteration o the
small muscular arteries in placental tertiary stem villi (Kingdom,
1997; Morrow, 1989).
Umbilical artery Doppler has been rigorously investigated to test o etal well-being. As described in Chapter 47
(p. 830), this tool aids management o etal-growth restriction and is associated with improved outcome in these cases
(American College o Obstetricians and Gynecologists, 2019a).
It is not recommended or other indications. Similarly, its use
as a screening tool or growth-restriction is not advised (Berkley, 2012). Abnormal umbilical artery Doppler ndings should
prompt a detailed etal evaluation, i not already done, because
abnormal measurements are oten associated with major etal
anomalies and aneuploidy (Wenstrom, 1991).
■ Ductus Arteriosus
Doppler evaluation o the ductus arteriosus is used primarily to
monitor etuses exposed to indomethacin and other NSAIDs.
Indomethacin may cause ductal constriction or closure, particularly when used in the third trimester (Huhta, 1987). Te
resulting increased pulmonary ow can cause reactive hypertrophy o the pulmonary arterioles and eventual development
o etal pulmonary hypertension. In a review o 12 randomized
trials involving more than 200 exposed pregnancies, Koren
and coworkers (2006) reported that NSAIDs raised the odds
o ductal constriction 15-old. Te risk is typically limited to
drug use greater than 72 hours’ duration. Monitoring or ductal constriction should be considered in such cases, so that the
NSAID can be discontinued i ductal constriction is identied.
Fortunately, eects are oten reversible ater NSAID discontinuation.
■ Uterine Artery
Uterine blood ow is estimated to rise rom 50 mL/min
early in gestation to 500 to 750 mL/min by term. Te uterine artery Doppler waveorm is characterized by high diastolic
ow velocities and turbulent ow. Greater resistance to ow
and development o a diastolic notch are associated with later
development o gestational hypertension, preeclampsia, and
etal-growth restriction. Zeeman and associates (2003) also
ound that women with chronic hypertension who had elevated
uterine artery impedance at 16 to 20 weeks’ gestation were at
greater risk to develop superimposed preeclampsia. However,
the technique, best testing interval, and dening criteria or this
indication have not been standardized. As the predictive value
o uterine artery Doppler testing is considered to be low, its use
or screening or hypertensive complications o pregnancy or
or etal-growth restriction is not recommended in either highrisk or low-risk pregnancies (American College o Obstetricians
and Gynecologists, 2019a, 2020b).
■ Middle Cerebral Artery
Doppler velocimetry o the middle cerebral artery (MCA) has
become the primary method o detecting etal anemia and is
central to surveillance o alloimmunized pregnancies. Anatomically, the path o the MCA is such that ow oten approaches
the transducer “head-on,” which allows accurate determination
o ow velocity (Fig. 14-11). Te MCA is imaged in an axial
view o the head at the base o the skull and ideally within
2 mm o the internal carotid artery origin. Velocity measurement is optimal when the insonating angle θ is close to zero,
and no more than 30 degrees o angle correction should be
used. In general, other etal vessels are not suitable or velocity assessment, because a larger insonating angle is needed and
coners signicant measurement error.

FIGURE 14-10 Doppler systolic–diastolic waveform indices of
blood flow velocity. S represents the peak systolic flow or velocity,
and D indicates the end-diastolic flow or velocity. The mean, which
is the time-average mean velocity, is calculated from computerdigitized waveforms.Obstetrical Imaging 263
CHAPTER 14
With etal anemia, the peak systolic velocity is enhanced due
to greater cardiac output and decreased blood viscosity (Segata,
2004). Tis permits the reliable, noninvasive detection o etal
anemia in cases o blood-group alloimmunization. Mari and
colleagues (2000) demonstrated that an MCA peak systolic
velocity threshold o 1.50 multiple o the median (MoM) could
reliably identiy etuses with moderate or severe anemia. As discussed in Chapter 18 (p. 355), MCA peak systolic velocity has
replaced invasive testing with amniocentesis as the preerred
test or etal anemia detection (Society or Maternal-Fetal Medicine, 2015a).
MCA Doppler has also been studied as an adjunct in evaluation o etal-growth restriction (Chap. 47, p. 830). Fetal
hypoxemia is associated with increased blood ow to the brain,
heart, and adrenal glands, which leads to greater end-diastolic
ow in the MCA. Tis phenomenon, called “brain-sparing,” is
actually a misnomer, as it does not protect the etus but rather
is associated with perinatal morbidity and mortality (BahadoSingh, 1999; Cruz-Martinez, 2011). o evaluate redistribution o blood ow, investigators have studied a ratio o the
MCA pulsatility index (PI) to the umbilical artery PI–termed
the cerebroplacental ratio. Like the S/D ratio, the PI estimates
downstream impedance to ow (Fig. 14-10). In the PORO
(Prospective Observational rial to Optimize Paediatric Health
in IUGR) study o ultrasound-dated pregnancies with estimated etal weights <10th percentile, etuses with a cerebroplacental PI ratio <1 had an 11-old greater risk or adverse
perinatal outcomes (Flood, 2014). Such ndings can urther
our understanding o etal pathophysiology. However, the utility o MCA Doppler to aid the timing o delivery is uncertain,
and it has not been adopted as standard practice in the management o growth restriction (American College o Obstetricians
and Gynecologists, 2021a; Martins, 2020).
■ Ductus Venosus
Te etal ductus venosus shunts oxygenated blood rom the
intrahepatic portion o the umbilical vein directly to the
inerior vena cava, thus bypassing the liver (Fig. 7-9, p. 127).
Te ductus venosus is imaged as it branches rom the umbilical
vein at approximately the level o the diaphragm. Te wave-
orm is biphasic and normally has orward ow throughout
the entire cardiac cycle (Fig. 14-12). Te rst peak reects
ventricular systole, and the second is ventricular diastolic lling. Tese are ollowed by a nadir during atrial contraction—
termed the a-wave.
It is believed that Doppler ndings in preterm etuses with
growth restriction show a progression in which umbilical artery
Doppler abnormalities are ollowed by ones in the MCA and
then in the ductus venosus. With severe etal-growth restriction, cardiac dysunction may lead to ow in the a-wave that is
decreased, absent, and eventually reversed and to pulsatile ow
in the umbilical vein (see Fig. 14-12). However, ductus venosus Doppler assessment has not improved perinatal outcomes,
and neither the American College o Obstetricians and Gynecologists (2021a) nor the Society or Maternal-Fetal Medicine
(Martins, 2020) recommend its use in the routine management
o etal growth-restriction.
MAGNETIC RESONANCE IMAGING
MR imaging is based on the excitation o hydrogen ions in
the body by pulsing radiorequencies with high eld-strength
magnets (1.5 to 3 esla). High-resolution etal imaging is now
possible, in part due to aster acquisition times o less than one
second per slice. Te relaxing hydrogen ions can be manipulated through various pulse sequences to produce dierent representations on images. Te classic example is simple uid, such
as amnionic uid or urine in the bladder, which appears bright
on 2-weighted and dark on 1-weighted image acquisitions.
Image resolution with MR is oten superior to that with
sonography because MR is less hindered by bony interaces,
maternal obesity, oligohydramnios, or an engaged etal head.
Tus, it can complement sonography in evaluating suspected
etal abnormalities. Examples include complex abnormalities o
the etal thorax and o the central nervous, GI, genitourinary,
A B

FIGURE 14-11 Middle cerebral artery (MCA) Doppler. A. Color Doppler of the circle of Willis demonstrates the correct location to sample
the MCA. B. The waveform shows a peak systolic velocity exceeding 70 cm/sec in a 32-week fetus with severe fetal anemia secondary to Rh
alloimmunization.264 The Fetal Patient
Section 6
and musculoskeletal systems. MR imaging is also used to
evaluate maternal pelvic masses and placental invasion. Tis
modality, however, is not portable, is time-consuming, and
is generally limited to reerral centers with expertise in etal
imaging.
o guide clinical use, the American College o Radiology
and Society or Pediatric Radiology (2020b) have developed
a practice guideline or etal MR imaging. Tis document
acknowledges the primacy o sonography as the preerred
screening modality. Moreover, it recommends that etal MR
imaging be used or problem solving to contribute to prenatal diagnosis, counseling, treatment, and delivery planning. At
Parkland Hospital, MR imaging is perormed in 15 percent
o pregnancies with major etal abnormalities (Herrera, 2020).
Specic indications are listed in Table 14-12 and are discussed
subsequently (American College o Radiology, 2020b).
■ Safety
MR imaging is not associated with known adverse etal eects
i perormed without administration o contrast media (Ray,
2016). It uses no ionizing radiation, and human and tissue studies support its saety (Clements, 2000; Reeves, 2010; Vadeyar,
2000; Wiskirchen, 1999). Te strength o the magnetic eld
is measured in tesla (T). Both 1.5 and 3 etal MR imaging can be done saely and successully, assuming expertise o
the imagers with the physical principles o MR (Prayer, 2017).
All clinical examinations must adhere to the specic absorption
rate, which is regulated by the FDA, and the ALARA principle
should be ollowed. Specically, the amount o heat generated
in the MR is reected in the specic absorption rate and must
be monitored.
Te Society or Pediatric Radiology recommends 3 MR
imaging because o its improved signal-to-noise ratio, which
results in better resolution (Barth, 2017). We preer 1.5 or
diagnostic imaging given its better eld homogeneity. We
reserve 3 or unctional imaging, which requires higher eld
strength.
Gadolinium-based MR contrast agents are gadolinium
(Gd3+) chelates. Tese contrast agents enter the etal circulation and are excreted via etal urination into amnionic uid.
Here, they may remain or an indeterminate period beore
being ingested and reabsorbed. Te longer time the gadolinium-chelate molecule remains in a protected space such as the
amnionic sac, the greater the potential or dissociation o the
toxic Gd3+ ion. In a population-based review rom Ontario,
children exposed to gadolinium-enhanced MR imaging in
utero were at slightly increased risk or a broad set o rheumatological, inammatory, or inltrative skin conditions (Ray,
2016). In adults with renal disease, this contrast agent is associated with development o nephrogenic systemic brosis, a
potentially severe complication. MR imaging with gadolinium
is not recommended in pregnancy without a lie-threatening
indication.
■ Technique
Beore MR imaging, all women complete a written saety questionnaire that includes inormation about metallic implants,
pacemakers, or other metal- or iron-containing devices. Highlevel magnetization may cause dangerous movement in these
devices, causing adjacent tissue damage and malunction.
(American College o Radiology, 2020a). Iron supplementation may cause image artiact in the colon but does not usually aect the resolution o etal images. In more than 4500
MR procedures perormed at Parkland Hospital in pregnancy
during the past 18 years, <1 percent o our patients suered
maternal anxiety secondary to claustrophobia. o reduce anxiety in this small group, a single oral dose o diazepam, 5 to 10
mg, or lorazepam, 1 to 2 mg, may be given.
A B

FIGURE 14-12 Venous Doppler abnormalities. A. Reversal of
a-wave flow in the ductus venosus. Arrows depict a-waves below
the baseline. This finding may be identified with cardiac dysfunction in the setting of severe fetal-growth restriction. B. Pulsatile
flow in the umbilical vein. The undulating umbilical venous waveform below the baseline indicates tricuspid regurgitation. Above
the baseline is the umbilical artery waveform, in which there is no
visible end-diastolic flow. Because the venous waveform is below
the baseline in this image, it is not possible to determine whether
the umbilical artery end-diastolic flow is reversed.Obstetrical Imaging 265
CHAPTER 14

TABLE 14-12. Fetal Conditions for Which Magnetic Resonance Imaging May Be Indicateda
Brain and spine
Agenesis of the corpus callosum
Cavum septum pellucidum abnormalities
Cephalocele
Cerebral cortical malformation or migrational abnormalities
Family history conferring a risk for brain anomaly
Hemorrhage
Holoprosencephaly
Hydranencephaly
Infarctions
Monochorionic twin pregnancy complications
Neural-tube defects
Posterior fossa abnormalities
Sacral agenesis (caudal regression)
Sacrococcygeal teratoma
Sirenomelia
Solid or cystic masses
Vascular malformations
Ventriculomegaly
Vertebral anomalies
Skull, face, and neck
Facial clefts
Goiter
Hemangiomas
Teratomas
Venolymphatic malformations
Other abnormalities with potential airway obstruction
Thorax
Bronchogenic cyst or congenital lobar overinflation
Congenital cystic adenomatoid malformation
Diaphragmatic hernia
Effusions
Extralobar pulmonary sequestration
Esophageal atresia
Mediastinal masses
Evaluation of pulmonary hypoplasia secondary to diaphragmatic hernia, oligohydramnios, chest mass, or skeletal dysplasia
Abdomen, pelvis, and retroperitoneum
Abdominopelvic cystic mass
Bowel anomalies (anorectal malformations, complex obstructions)
Complex genitourinary anomalies (bladder outlet obstruction syndromes, bladder exstrophy, cloacal exstrophy)
Renal anomalies with oligohydramnios
Tumors (sacrococcygeal teratoma, neuroblastoma, hemangioma, suprarenal or renal masses)
Complications of monochorionic twins
Assess morbidity after death of a monochorionic co-twin
Determine vascular anatomy prior to laser treatment
Evaluate conjoined twins
Fetal surgery assessment
Anomalies for which fetal surgery is planned
Fetal brain anatomy before and after surgical intervention
aIn some cases, magnetic resonance imaging is indicated only if the anomaly is suspected but cannot be adequately
characterized sonographically, which is assessed on a case-by-case basis.
Summarized from American College of Radiology, Society for Pediatric Radiology: ACR-SPR practice parameter for the safe
and optimal performance of fetal magnetic resonance imaging (MRI). Resolution No. 45, 2020.266 The Fetal Patient
Section 6
o begin an MR examination, women are placed in a supine
or let lateral decubitus position. A torso coil is used in most
circumstances to send and receive the radiorequency pulses,
but a body coil can be used alone to accommodate large maternal habitus. A series o three-plane localizers, or scout views,
are obtained relative to the maternal coronal, sagittal, and
axial planes. Te gravid uterus is imaged in the maternal axial
plane (7-mm slices, 0 gap) with a 2-weighted ast acquisition.
ypically, these may be a single-shot ast spin echo sequence
(SSFSE), hal-Fourier acquisition single-shot turbo spin echo
(HASE), or rapid acquisition with relaxation enhancement
(RARE), depending on the machine. Next, a ast 1-weighted
acquisition such as spoiled gradient echo (SPGR) is perormed
(7-mm thickness, 0 gap). Tese large-eld-o-view acquisitions
through the maternal abdomen and pelvis are particularly good
or identiying etal and maternal anatomy.
Orthogonal images o targeted etal or maternal structures
are then obtained. In these cases, 3- to 5-mm slice thickness,
0 gap 2-weighted acquisitions are perormed in the coronal, sagittal, and axial planes. Depending on the anatomy and
underlying suspected abnormality, 1-weighted images can be
perormed to evaluate or subacute hemorrhage, at, or location
o normal structures that appear bright on these sequences, such
as liver and meconium in the colon (Brugger, 2006; Zaretsky,
2003b).
Short T1 inversion recovery (STIR) and requency-selective
at-saturated 2-weighted images may help dierentiation in
cases in which the water content o the abnormality is similar
to that o the normal structure. An example is a thoracic mass
compared with normal lung. Diusion-weighted imaging may
be employed to evaluate or restricted diusion, which can be
seen in ischemia, cellular tumors, or clotted blood (Brugger,
2006; Zaretsky, 2003b).
■ Fetal Anatomy Evaluation
A etal anatomical survey is generally completed during the
MR examination, regardless o the etal indication. Nearly
95 percent o anatomical components recommended by the
International Society o Ultrasound in Obstetrics and Gynecology were visible at 30 weeks’ gestation (Millischer, 2013). Te
aorta and pulmonary artery were the most difcult to evaluate.
Zaretsky and coworkers (2003a) similarly ound that with the
exclusion o cardiac structures, etal anatomical evaluation was
possible in 99 percent o cases.
■ Central Nervous System
For intracranial anomalies, ast 2-weighted images produce
excellent tissue contrast. Cerebrospinal uid–containing structures appear bright, which allows exquisite detail o the posterior ossa, midline structures, and cerebral cortex. 1-weighted
images are used to identiy hemorrhage. CNS biometry
obtained with MR imaging is comparable with that obtained
using sonography, and nomograms are available or the corpus
callosum and cerebellar vermis (Harreld, 2011; Katorza, 2016;
wickler, 2002; Xi, 2016).
MR imaging may provide valuable added inormation when
cerebral abnormalities are identied or suspected sonographically (Benacerra, 2007; Li, 2012). Additional inormation is
more likely to be gained when the examination is perormed
beyond 24 weeks’ gestation. In studies, MR imaging has identi-
ed additional CNS ndings or led to a changed diagnosis in
nearly 50 percent o cases and aected prognosis or management in 20 percent (Grifths, 2017, wickler, 2003).
MR imaging accurately portrays cerebral gyration and sulcation patterns (Fig. 14-13) (Levine, 1999). It may assist with
identiying agenesis or dysgenesis o the corpus callosum and
characterizing migrational abnormalities (Benacerra, 2007;
Li, 2012; wickler, 2003). In cases o septo-optic dysplasia,
MR imaging may conrm absence o the septum pellucidum
and display hypoplastic optic tracts (Fig. 14-14). When etal
intracranial hemorrhage (ICH) is suspected, MR imaging can
help to characterize the extent o bleeding and to estimate when
bleeding occurred. Risk actors or etal ICH include atypicalappearing ventriculomegaly, concern or neonatal alloimmune
thrombocytopenia, and severe S or demise o one monochorionic twin (Hu, 2006). With congenital etal inections,
MR imaging can delineate the variable
degrees o neural parenchymal abnormality and subsequent maldevelopment
(Soares de Oliveira-Szejneld, 2016).
■ Thorax
MR imaging can delineate the location
and size o space-occupying thoracic
lesions and quantiy the volume o lung
tissue. I needed, it can characterize blood
ow to a thoracic mass to dierentiate
cystic adenomatoid malormation rom
pulmonary sequestration (Chap. 15, p.
287). With congenital diaphragmatic
hernia, MR imaging can help veriy and
quantiy the abdominal organs within the
thorax (Debus, 2013; Lee, 2011; Mehollin-Ray, 2012). Tis includes the volume
A B

FIGURE 14-13 Axial images of the fetal brain demonstrate the normal gyration and sulcation progression during fetal development. A. 23 weeks’ gestation. B. 33 weeks’ gestation. These images were obtained using a Half Fourier Acquisition Single Shot Turbo Spin
Echo (HASTE) sequence because it is relatively motion insensitive.Obstetrical Imaging 267
CHAPTER 14
o herniated liver and o compressed lung
tissue (Fig. 14-15). MR imaging can also
measure lung volumes in pregnancies with
prolonged oligohydramnios secondary to
renal abnormalities or ruptured membranes (Messerschmidt, 2011; Zaretsky,
2005).
■ Abdomen
Meconium accumulation within the GI
tract gives a predictable pattern and has
high signal intensity on 1-weighted
sequences. Tus, MR imaging is a
complementary tool in diagnosing GI
abnormalities and complex cloacal mal-
ormations (Furey, 2016). With cystic
abdominal abnormalities, dierences in
signal characteristics may also help distinguish between meconium in the etal colon and urine in the bladder (Farhataziz,
2005). Peritoneal calcications related to meconium peritonitis
are more readily apparent sonographically, whereas pseudocysts
and resultant abnormalities o meconium
migration are better delineated with MR
imaging.
■ Adjunct to Fetal Therapy
Prior to etal surgery, MR imaging is
oten used. In cases o myelomeningocele, it precisely displays brain and spine
anatomy. For sacrococcygeal teratomas,
i etal surgery is considered, MR imaging may identiy tumor extension into the
etal pelvis (Avni, 2002; Neubert, 2004;
Perrone, 2018). When a etal neck mass is
identied with ultrasound, MR imaging
may help delineate a lesion’s extent and its
mass eect on the oral cavity and trachea.
Tis can help identiy cases that are at risk
or adverse outcome and that may benet
rom an ex utero intrapartum treatment
(EXI) procedure (Lazar, 2012; Ogamo,
2005; Ng, 2019). MR imaging can also
calculate a jaw index when an EXI procedure may be needed or severe micrognathia (Kooiman, 2018; Morris, 2009).
At some centers, beore laser ablation o
placental anastomoses or S, MR
imaging is perormed to identiy etal
ICH or periventricular leukomalacia (Hu,
2006; Kline-Fath, 2007). Fetal therapy is
discussed in Chapter 19 (p. 367).
■ Placenta
Despite improvements in ultrasound
detection o PAS, particularly when the
placenta is anterior, characterization o
the extent o invasion remains a challenge. MR ndings concerning or invasion are depicted in Figure 14-16. Tey include
dark intraplacental bands on 2-weighted images, a ocal bulge,
placental heterogeneity, involvement o the bladder-uterine
A B

FIGURE 14-14 Septo-optic dysplasia. A. Axial. B. Coronal. Images at 30 weeks’ gestation
confirm absence of the cavum septum pellucidum (arrowheads) in both. There is also
associated mild ventriculomegaly (arrow).
H
A B
C D

FIGURE 14-15 A. Coronal image of normal lungs on a balanced sequence at 29 weeks’
gestation. The liver (L) and stomach (S) lie below the diaphragm. B. Left-sided congenital
diaphragmatic hernia (CDH) (dotted ellipse) seen on balanced sequence at 33 weeks.
C. The T1-weighted sequence confirms the subdiaphragmatic position of the liver and
better delineates the small bowel (arrow) and meconium-containing colon (arrowhead)
that have herniated into the chest. D. Another image of a left-sided CDH at 22 weeks demonstrates no normal lung, the heart (H) displaced into the right chest, and an elevated liver
(dotted ellipse).268 The Fetal Patient
Section 6
serosal interace, and brin deposition (Clark, 2020; Leyendecker, 2012). When used to complement ultrasound, MR
imaging’s sensitivity to detect invasion is high. Clark and associates (2020) reported that MR imaging ndings positively
correlated with need or cesarean hysterectomy and with histological and surgical impressions o invasion. Clinical risk actors
and ultrasound ndings (p. 253) should be incorporated when
interpreting MR placental images (Chap. 43, p. 759).
wo emerging technologies also are being employed to
investigate placental insufciency and PAS. Arterial spin labelling is a technique or unctional assessment o perusion and
excites maternal red blood cells to serve as endogenous contrast
agents (Zun, 2018). Second, radiomics textural analysis characterizes placental morphology in vivo. MR textural eatures may
help select pregnancies requiring cesarean hysterectomy (Do,
2020).

FIGURE 14-16 A. Sagittal T2-weighted image of the placenta
demonstrates placenta accreta spectrum (PAS), in this case placenta percreta. There are intraplacental, dark, linear bands (arrows),
a large bulge along the bladder-serosal interface (arrowheads), and
a central area of marked inhomogeneity (asterisk). B. A coronal
image from the same study demonstrates the bulge with right
lateral extension (arrowheads) and multiple, dark, linear bands
(arrows). C. A sagittal, balanced, steady state free precession (SSFE)
image shows a bulge, retroplacental vessels, and irregularity of
the bladder-serosal interface (arrowheads). These contrast with the
large maternal varices (arrows). F = fetus
Nhận xét
Đăng nhận xét